Cebu vs Metro Manila, Cagayan de Oro and Davao: compare the deal, not the headline
CebuPropertyMan editorial analysis · Research checked October 11, 2026
Does Cebu offer a better rental investment than the rest of the Philippines? Metro Manila alone cannot answer that question. Cagayan de Oro and Davao belong in the comparison, particularly for investors considering Mindanao. We separate published yield evidence from city-specific strategies that still require local lease and price verification.

Photo credits


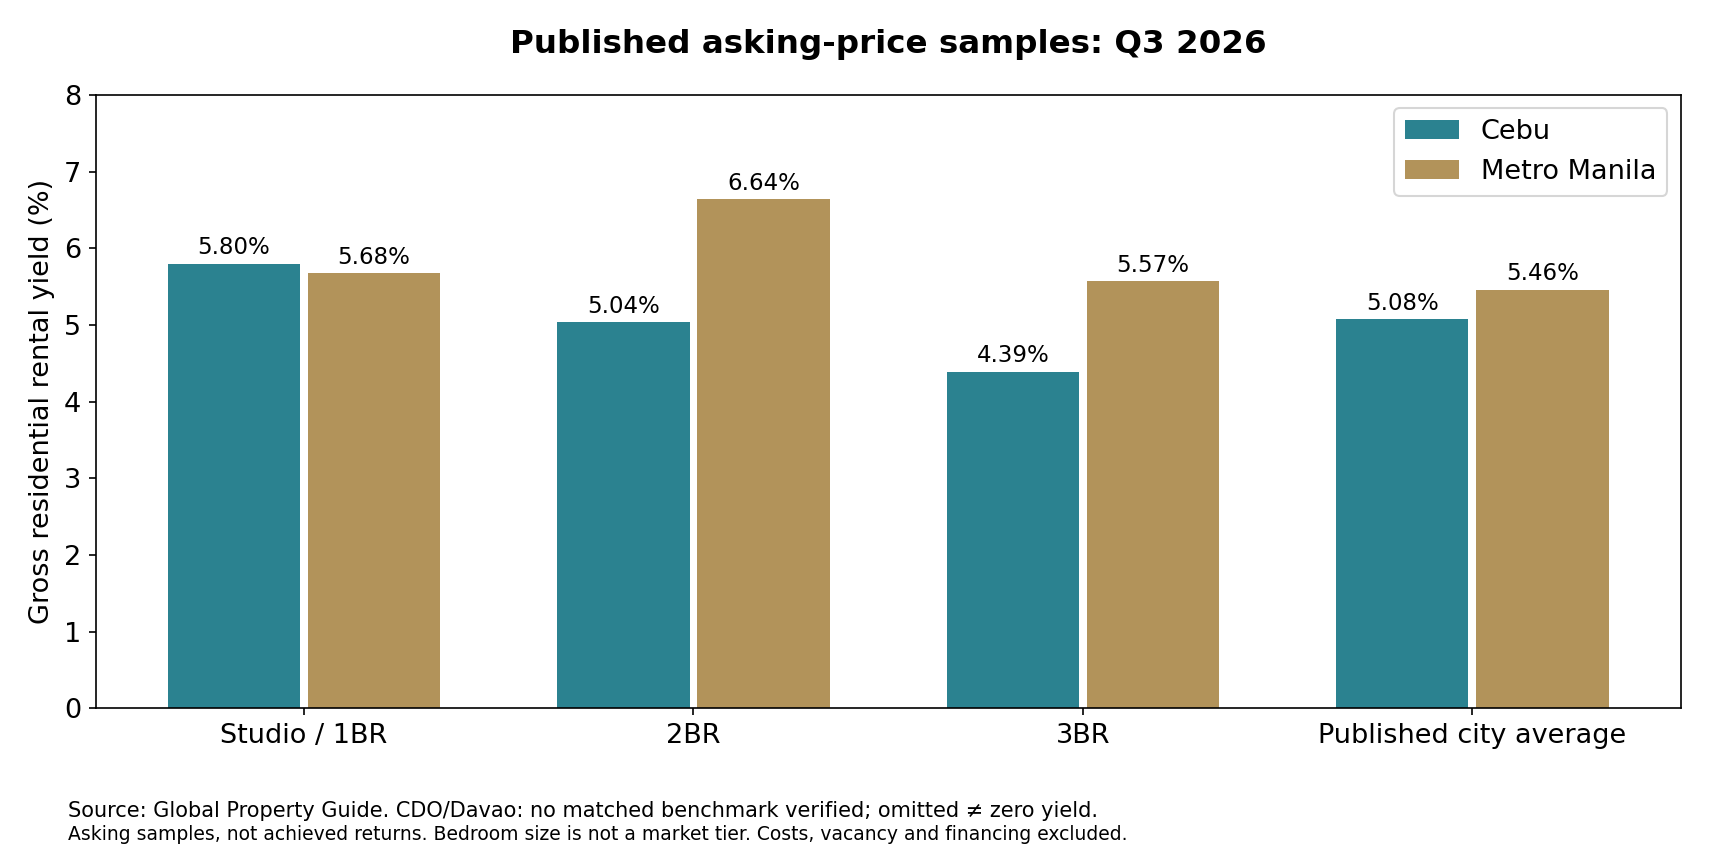
The comparable published benchmark: Cebu and Metro Manila
Global Property Guide’s Q3 2026 asking-price sample reports an average gross residential rental yield of 5.08% for Cebu and 5.46% for Metro Manila. Its Philippines figure is based on covered markets; it is not evidence for every Philippine city. The sample uses advertised prices and rents, not completed transactions or guaranteed returns. It does not establish Cagayan de Oro or Davao yields. Source 1.
On mobile, swipe the table to see all columns.
| Published sample | Cebu gross yield | Metro Manila gross yield |
|---|---|---|
| Studio / 1-bedroom | 5.80% | 5.68% |
| 2-bedroom | 5.04% | 6.64% |
| 3-bedroom | 4.39% | 5.57% |
| Published city average | 5.08% | 5.46% |
Bedroom counts are not equivalent to low-, mid- and high-end tiers. These sample averages also do not control for neighbourhood, building age or quality. A 0.38-percentage-point average advantage is too small to override large differences in vacancy, maintenance or acquisition costs.
Four markets, distinct investment tests
On mobile, swipe the table to see all columns.
| Market | Residential tiers to investigate | Commercial segment to investigate | Main underwriting issue |
|---|---|---|---|
| Cebu | Lower-budget worker units; mid-budget family apartments; premium executive homes | Office, retail and logistics measured separately | Entry premium versus verified tenant rent and competing inventory |
| Metro Manila | Affordable commuter housing; mid-market employment catchments; premium CBD units | CBD office, neighbourhood retail and industrial assets have different economics | Submarket vacancy, incentives, building costs and commuting access |
| Cagayan de Oro (CDO) | Lower-budget workforce/student units; mid-budget family homes; premium gated homes | Neighbourhood retail, offices and logistics assessed separately | Prove actual tenant demand and achieved rent before assuming cheaper capital means higher yield |
| Davao City | Lower-budget worker/student units; mid-budget family housing; premium condos/homes | Cost-conscious offices and local-service retail | New residential supply, lease-up time and micro-location |
Metro Manila: a bigger market still contains weak deals
Compare individual submarkets and buildings rather than a metro-wide average. Asking rent can conceal incentives and long periods without a tenant. Office statistics cannot be used as residential yields, and an office investment benchmark cannot describe small shops. Request evidence of effective rent after incentives and actual service charges.
Cagayan de Oro: include it, without inventing a return
Colliers identifies Cagayan de Oro among regional tourism opportunities in its July 2026 report. That is a reason to investigate, not proof of holiday-rental occupancy or citywide yield. Our analysis is to test affordable housing against wage-supported rent, mid-market homes against sustained family demand, and premium properties against a narrower tenant pool. For commercial purchases, distinguish a shop’s foot traffic from an office’s lease requirements and a warehouse’s access needs.
Davao: demand must keep pace with new supply
Colliers discusses cost-efficient office options in Davao and regional condo deliveries led by Cebu and Davao. For investors, the inference is to stress-test absorption rather than assuming all new developments will rent quickly. Lower-budget units need attainable rent; mid-market homes need neighbourhood-specific tenant evidence; premium units need a demonstrated executive tenant. None of these observations is a measured Davao yield.
How much capital—and what rent would justify it?
On mobile, swipe the table to see all columns.
| Illustrative tier / asset | All-in capital assumption | Monthly rent needed for 6% gross | Operating yield under assumptions |
|---|---|---|---|
| Lower-budget residential | ₱3M | ₱15,000 | 4.05% |
| Mid-budget residential | ₱6M | ₱30,000 | 4.05% |
| Higher-budget residential | ₱12M | ₱60,000 | 4.05% |
| Small commercial premises | ₱5M | ₱25,000 | 4.08% |
| Mid-budget commercial | ₱15M | ₱75,000 | 4.08% |
| Higher-budget commercial | ₱30M | ₱150,000 | 4.08% |
These are analyst-created capital scenarios, not local price ranges, quotations or observed yields. Lower/mid/higher budget describes this model, not an official market classification. Capital means total acquisition, closing, fit-out and initial reserve costs. At a 6% scheduled gross yield, residential vacancy of 10% and operating costs of 25% of collected rent produce 4.05% operating yield; commercial vacancy of 15% and costs of 20% produce 4.08%. Operating yield is before debt service and income tax. Replace every assumption with evidence for the actual property.
The yield hurdle matters more than the city label
For a hypothetical ₱6M all-in residential purchase, ₱30,000 monthly rent produces 6% scheduled gross yield. Under the vacancy and cost assumptions above, annual operating income is ₱243,000. If actual rent is only ₱25,000, gross yield falls to 5% and operating yield to 3.38%. The same arithmetic applies in Cebu, Manila, CDO or Davao. Financing payments could reduce cash flow further.
Evidence gaps and the practical verdict
We have not verified a current, consistently defined city-by-tier yield series for CDO and Davao or matched commercial capital values across all four markets. Their absence from the benchmark chart means missing comparable evidence, not zero yield. Cebu can be a good destination when a specific property’s rent supports its price. A well-priced CDO or Davao property may be better than an overpriced Cebu purchase; the available evidence does not justify a blanket ranking. Compare all-in cost, signed or achievable leases, vacancy, recurring costs and resale depth before deciding.
Research sources
- Global Property Guide — Philippines rental yields October 2026 Q3 2026 ↗
- Colliers — VisMin report July 2026 ↗
- Colliers — Residential report Q2 2026 ↗
- Cushman and Wakefield — Investment MarketBeat Q2 2026 August 17 2026 ↗
- CBRE — Philippines Office Figures Q2 2026 ↗